
KPI Report
Reports on Retailer and Marketplace KPIs. Includes some year on year graphs to show trends over the years.
Retailer Metrics
The purpose of this report is to provide numbers for retailers who are New, Churned and Active for each month.
Tables can't be imported directly. Please insert an image of your table which can be found here.
NewCount of new retailers for the month.
Defined as (created_at_date > 1st of the month and created_at_date <= last day of month) and (suspend_date > last day of the month or suspend_date is null).
ChurnCount of churned retailers for the month.
Defined as created_at_date < 1st of month and suspend_date > 1st of month and suspend_date <= last day of month.
Active New / Churn GMV GMV2Months
The report should balance out as - (Previous months Active - Previous Months Churn) + Current Months New = Current Months Active. As we base churned off suspend date there will be discrepancies if sites have been marked as inactive without a suspend date being added at the same time via a database update. Retailers who were previously suspended and becoming inactive again will also make the numbers not add up.
This report provides some interactive drill downs to allow more details, specifically relating to Churn. By clicking on any cell in the 1st table all other tables and graphs will filter for that specific value.
For example - Below we click on the Churn total for Omnivore-SMB retailers.
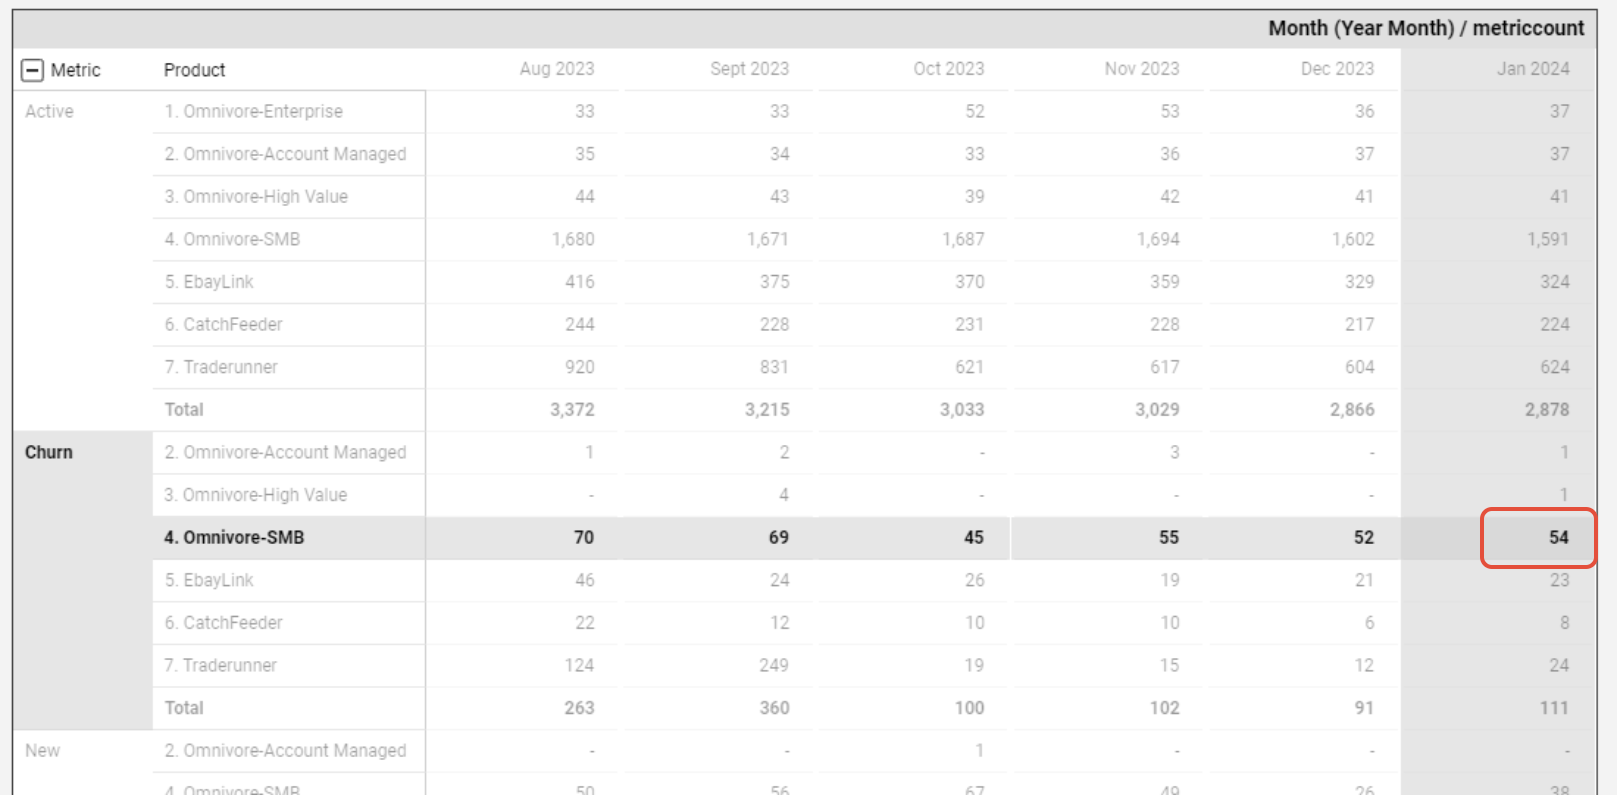
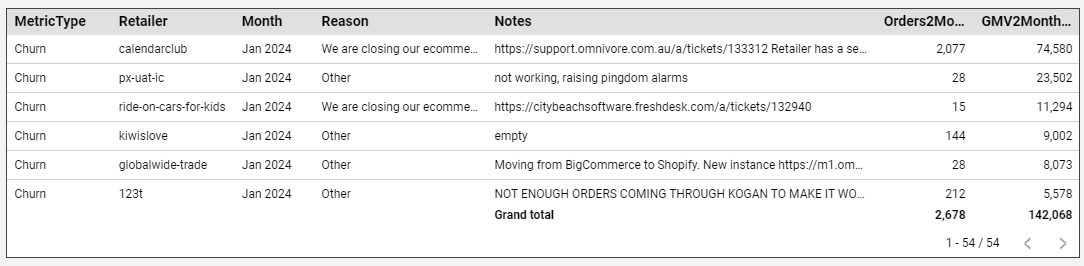
All tables and graphs will filter to only show data for the Churned / Omnivore- SMB retailers. Table 3 will show the Suspend Reason and Notes that have been entered during the suspension of the retailers.
Year on Year Graphs
The purpose of this report is to show the year on year trend for GMV, Active, New and Churned Retailers.
Available filters are Account Type and EcomType.
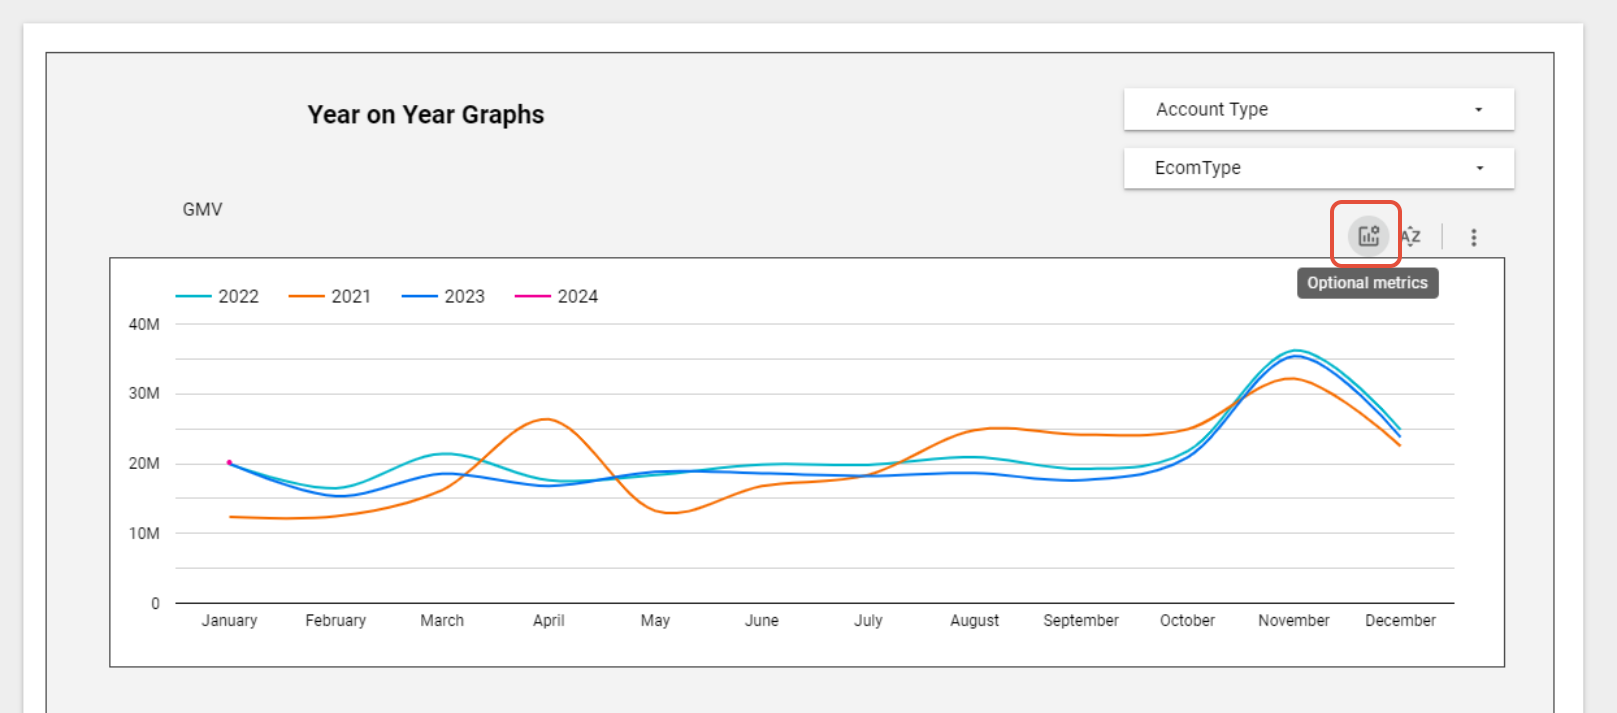
There are 2 metrics available on the GMV graph. The default metric is GMV, this is a GMV total for the month. The additional available metric is GMV2Months. This metric is the total of the previous 2 months GMV. For example Dec2023 value will be the total of Oct 23 and Nov 23 GMV.
Switch between the available metrics by clicking on the Optional Metrics icon.
Marketplace KPIs
The purpose of this report is to show the number of new marketplaces going live each month, the total GMV for each marketplace per month, Total number of retailers per month and Average GMV per retailer on each marketplace.
New Instances Live
Total count of retailers who hit start selling on the marketplace by month.
GMV by Month
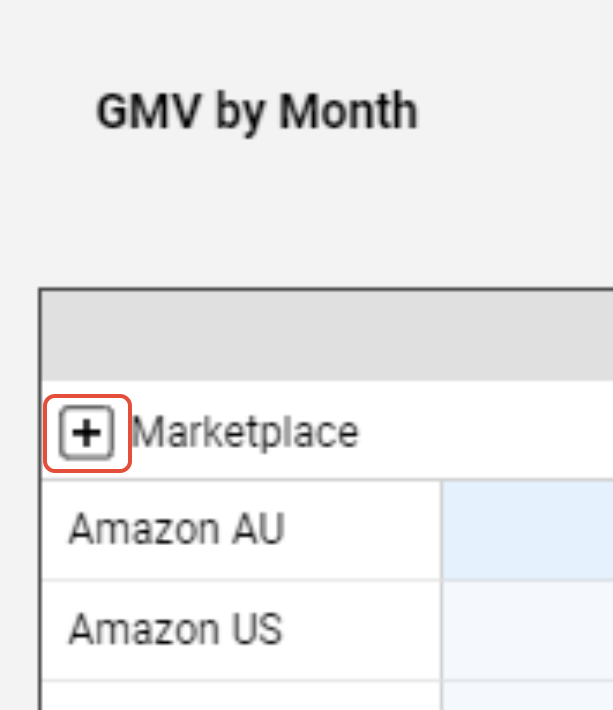
Total GMV per Marketplace by Month. This table can be expanded to show by Account Tier also by clicking the + icon.
Number of Retailers by Month
This is the distinct number of retailers who had orders within the month. Whilst more retailers could be live on the site for the month we do not currently have a way to determine if they have paused or terminated the marketplace within the warehouse data.
This table can be expanded by Account Tier.
Average GMV per Retailer by Month
This is calculated as the Total GMV for the month / Total number of retailers with orders for the month.
This table can be expanded by Account Tier.
Total Active Retailers with an order by Month
This table is similar to the 'Number of Retailers by Month' except it only counts retailers who are still active at the end of the month.
This table can be expanded by Account Tier.
Monthly Process for Updating
Initial Monthly Checks
- Check for any changes to account tiers
- Export company list from freshdesk
- Export peg.company_tier table
- use vlookup (eg =VLOOKUP(A8,Company_AM_Compare!$A$1:$B$140,2,FALSE)) to compare and look for changes to lists
- Update peg,company_tier as needed
- Check for new categories
- run 'CreateMasterCategoriesTable' sql (in KPI Reporting folder)
- run 'find_missing_mapped_categories'
- Any categories returned by this query need a master category allocated in the CreateMasterCategoriesTable sql
Dataset Creation
Work through the tables in each report portal. The dataset names used match the queries names. Most queries require a date parameter to be updated at the top of the query.
Run each query, save results and upload to looker studio
Some datasets are used across the different report portals and need to be updated on each one.